
Inside the Corner - Jan 2026
World-record, Hit-rates, Intrinsic Value and Portfolio Update


Disclaimer: This newsletter is provided for informational and educational purposes only. The analysis shared is based on my personal research and is not tailored to individual circumstances. The views expressed are my own and do not constitute financial advice or recommendations to buy or sell any securities.
Investor AB set a record in 2025 — beating the index for 15 consecutive years! We believe an underappreciated metric in general, but also of this conglomerate, is hit-rate. Over the last decade, 10 of 15 (66%) existing Listed holdings delivered market beating returns (13% CAGR for MSCI World Index), despite having a low portfolio turnover (trading activity). Most current holdings where there 10 years ago.
If we also include Patricia Industries and EQT AB, Investor’s hit-rate was >70% (!).
HIT-RATE
A simple exercise that any investor can do is to review all past positions, including exited ones, and categorize them by whether they beat a relevant benchmark. When we ran this analysis on our own history (Exhibit II), it made us appreciate a few things.
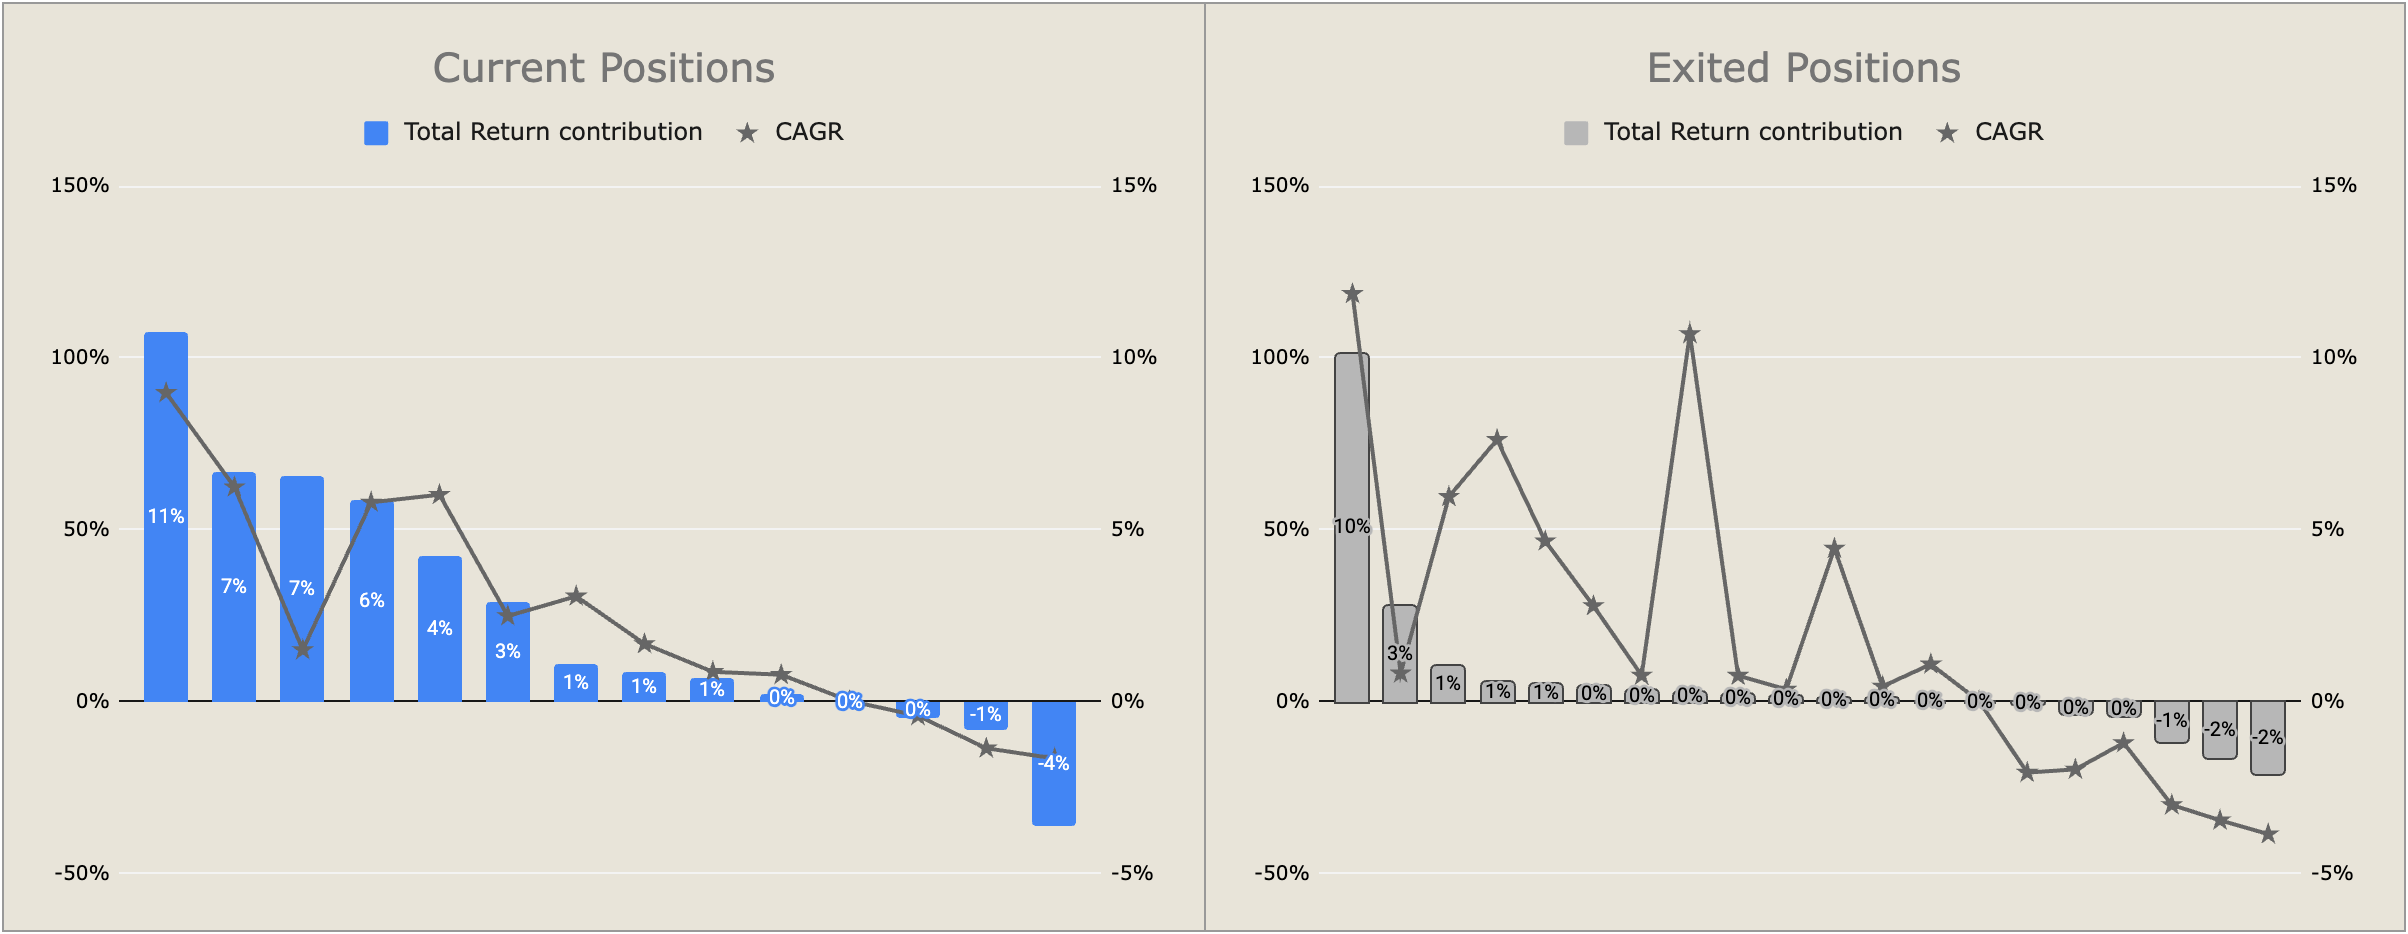
Avoid the big losers, and the winners will take care of the portfolio’s returns. Thus, High risk–high reward is not our game to play.
Most positions don’t contribute, despite taking up a lot of research time and also mental bandwith. Losing money hurts more than winning. Those -2% contributors to the right feel much more significant than those 3-4% positive contributors to the left.
Further concentration would likely hurt results. We do not believe we could have predicted in advance which holdings would’ve become the biggest winners, nor the magnitude of their success. This creates a dynamic similar to the idea that “time in the market beats timing the market”: Long-term success are driven by having winners in the portfolio — even if they start as small positions.
Let’s go back to Investor’s Hit-rate, we think there are more lessons to draw. If we compare it to another Holding Company like Exor, how do those compare?
From 2016 until 2025, both grew Net Asset Value (NAV) nicely, Investor by 13% annually and Exor 9%. Exor's NAV went from €14 to €35 billion, with more than €13 billion of that NAV increase was from their Ferrari stake alone (>60% contribution). This means that the reminding positions generated subpar shareprice CAGR of 2% for the Agnelli family. Adding dividends (not much from Ferrari), the CAGR for the rest was likely closer to high single-digits. Arguably, not as bad as one may think.
Investor, on the other hand, had multiple winners. Patricia Industries, ABB and Atlas Copco were the largest contributors. We believe the table below, showcase why Investor deserves to trade at a premium to Exor’s portfolio. They delivered more consistent strong returns across the portfolio. Note that dividends received are included in the column to the right for both, which is more impactful for Exor.
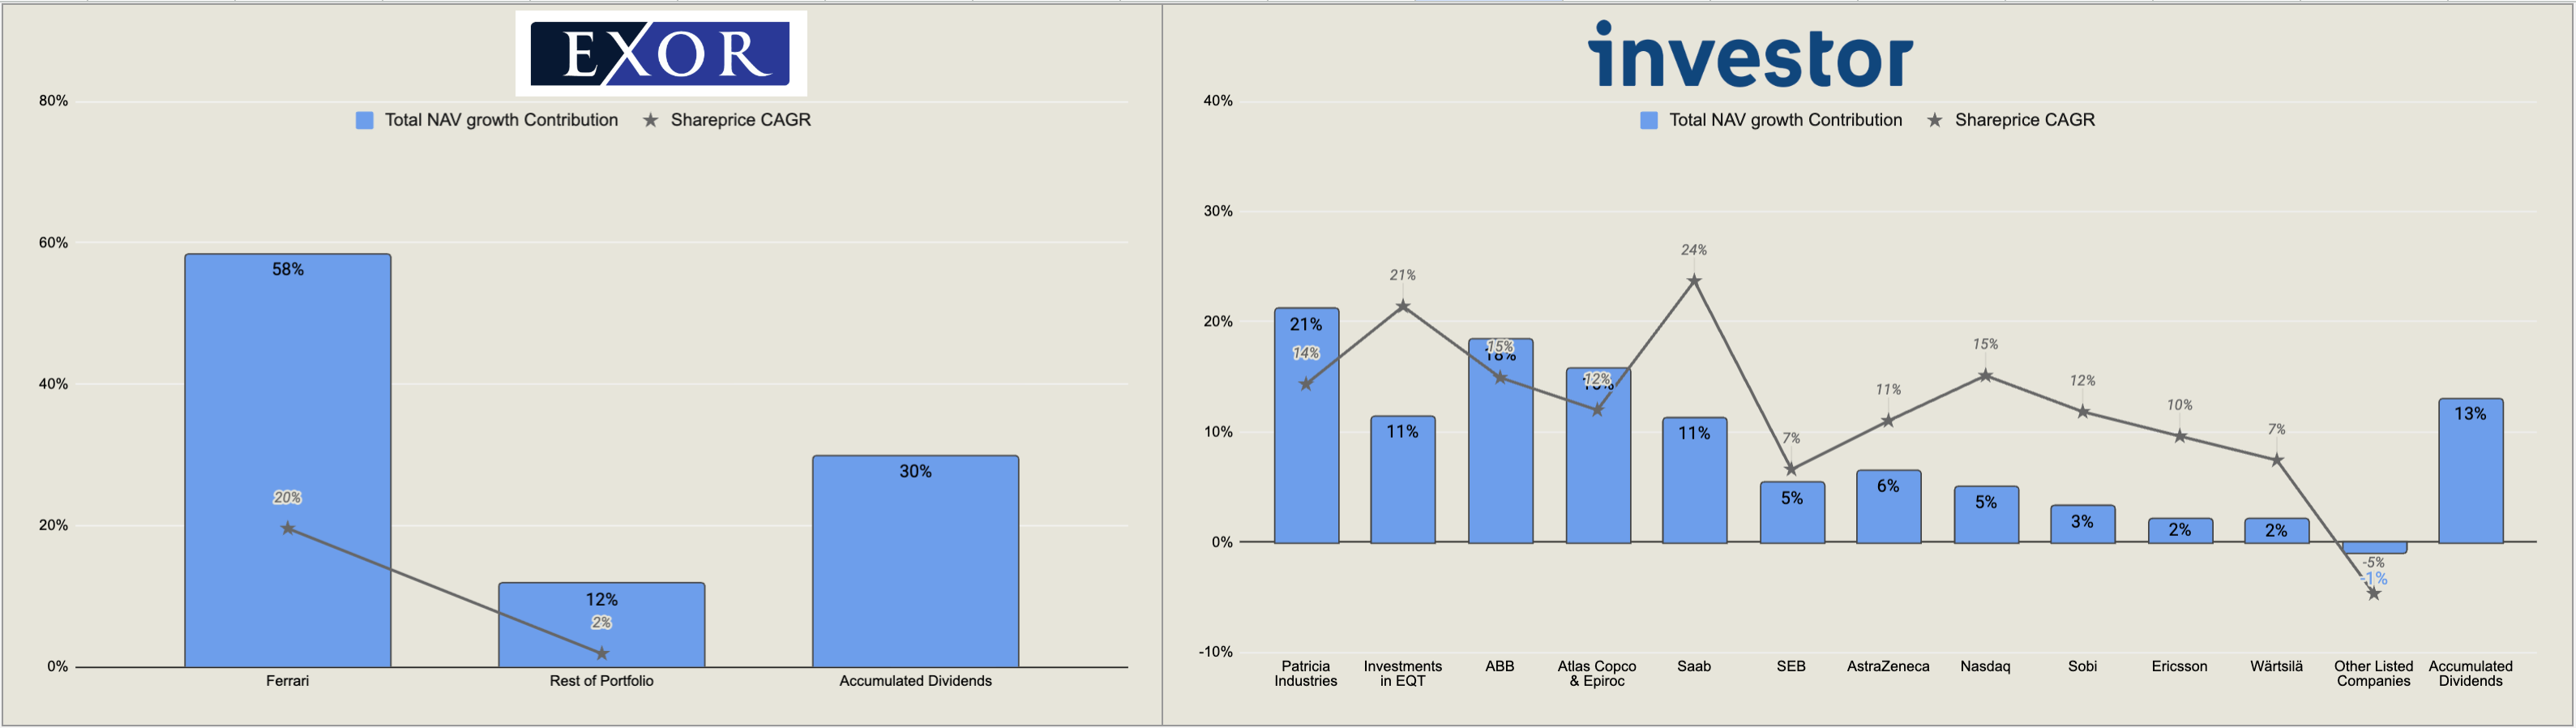
We would argue that Investor’s portfolio is also better positioned for the future. But this is also the consensus view — something the market signals through Exor’s substantial discount to Net Asset Value relative to Investor. The discount may even be so deep that Exor’s challenges are not only recognized, but more than fully priced in.
That said, valuation alone is not enough for us. In the section ahead, where we discuss Intrinsic Value, it becomes clear why Exor fits our framework far less naturally than Investor. Our key takeaway from studying Exor was that its combination of cyclical exposure and an unusually heterogeneous portfolio makes it extremely difficult to rely on any meaningful measure of “underlying profitability”.
One could argue that investing in Exor is essentially buying Ferrari and getting almost everything else for free. But if that is the thesis, what is the exit — selling once the discount closes? For us, that is not a sufficient framework.
A credible investment case for Exor would, in our view, need to look different. We focus less on the headline discount to NAV and more on management’s ability to compound intrinsic value over time. Exor has been explicit that Industry is not a long-term priority, with luxury, technology, and healthcare identified as the core focus areas. Yet today, cash flows remain overwhelmingly industrial. Seen through this lens, investments such as Philips make strategic sense—and offer a glimpse of what the portfolio could evolve into. If Elkann & Co. succeed in this transition, the combination of share buybacks at a wide discount, substantial dividends from cyclical industrial holdings, continued growth in Ferrari, and the gradual introduction of more stable cash generators could create the conditions for a classic multiple engine for it’s stock.
Thus, an investment case for us in Exor would have to rest on deep trust in management’s ability to allocate cyclical cash flows intelligently into new long-term opportunities aligning with their objectives.
We are not convinced there yet.
But now, let’s go over the key topic of today — how we measure our companies progress and how to potentially find buying opportunities more cleverly than we had in the past. The commonality for both: how to estimate a business’ Intrinsic Value.
Intrinsic Value
If book value per share is no longer the best metric to monitor our value creation over time, what is? We suggest intrinsic value growth over time.
As a “Surgeon General’s warning,” we completely believe that no intrinsic value calculation is perfect. Any calculation involves estimates and trade-offs between simplicity, understandability, and precision. We didn’t create a spreadsheet with fifty lines. We don’t wish to communicate any false sense of precision. But we realize we can’t draw a line with a slope of ascent without some point estimates along the way. (Thomas Gayner, 2024 Markel Annual Report)
We believe Tom presents us the tools needed to do this ourselves. The rest of this writeup will be exclusive for paid members, where we’ll go through how we did this with our 10 core Portfolio Holdings and go over the Portfolio Update as usual.