
Performance
Hi,
Here’s a brief update on our investing journey so far — the kind of summary I always appreciate from other newsletters. However, these portfolio statistics are easy to tweak, but I’ll try anyway. You’ll also see my rough patches, like the big drawdown a year after starting out. And you’ll see why we believe the number we end up with (~20% CAGR), overstates our actual performance by a wide margin.
When it comes to investing, like in other disciplines, it’s hard to know whether good results came because of what you did, or despite it. For all we know, especially given our short track-record, we may have been on a lucky streak so far.
Let’s break down how we got to our 20-ish percent CAGR figure.
A problem with returns for individual portfolio’s is timing of cashflows. Hopefully, especially when we are young, we’ll be able to invest more than we take out.
But, this means all your Invested Capital had different amounts of time to work for you, not like looking backwards on a stock ticker. A way to work around this is Money-Weighted returns, where the cashflow is weighted compared to how much time it has worked for you.
We will come to that figure in just a minute, but first I want us to go through the steps to get there, for those wanting to try this for their own investment journey. I had to do some reading myself to figure this one out myself (and get the numbers right).
Cash Flow & it’s role on Returns
Below, you can see how my portfolio has developed over time, when indexed to a starting point of $100. Most months you will see that capital has gone into the portfolio, thus the negative cashflow. You can also see the Portfolio Value increasing over time, but that should also be expected when so much capital has gone into it.
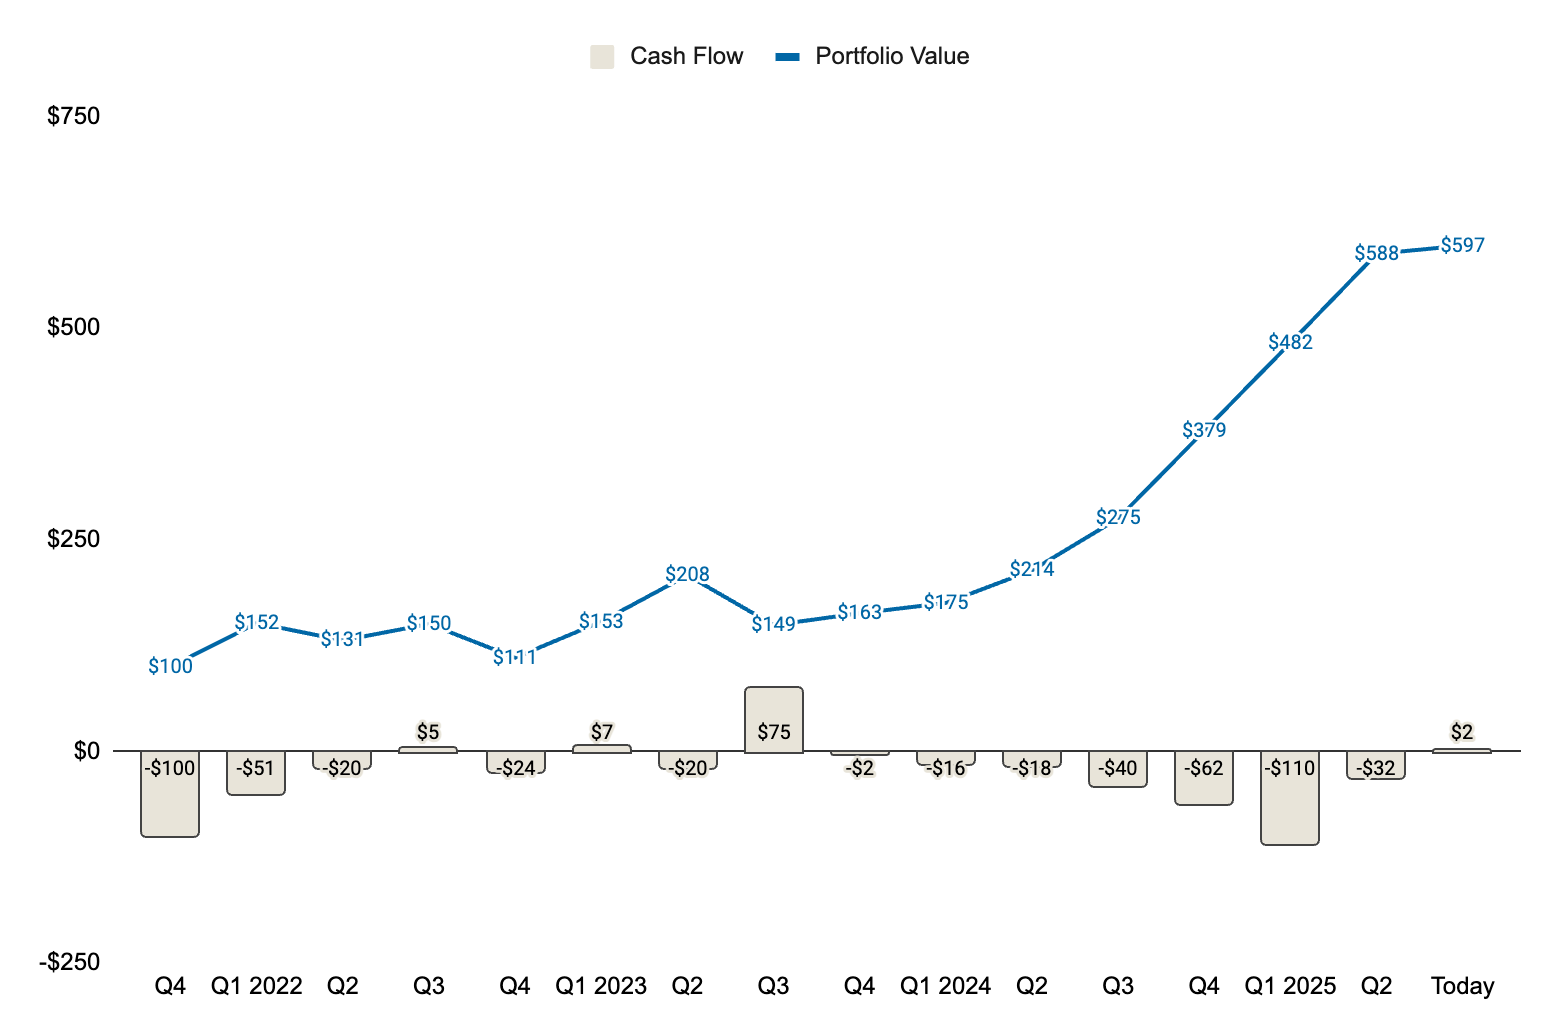
The interesting question then becomes, how much of this increase came from our returns, and how does this compare to the alternative of index investing?
Portfolio vs MSCI World Index
Rather than showing negative cash flows, the columns below represent Total Invested Capital — the cumulative figure that increases when we added capital and decreases when we receive dividends or sell stocks.
The gap between the columns and the lines shows what that invested capital would have grown to if invested in either our portfolio or a realistic alternative, the MSCI World Index. This highlights the return on the capital actually deployed over time.
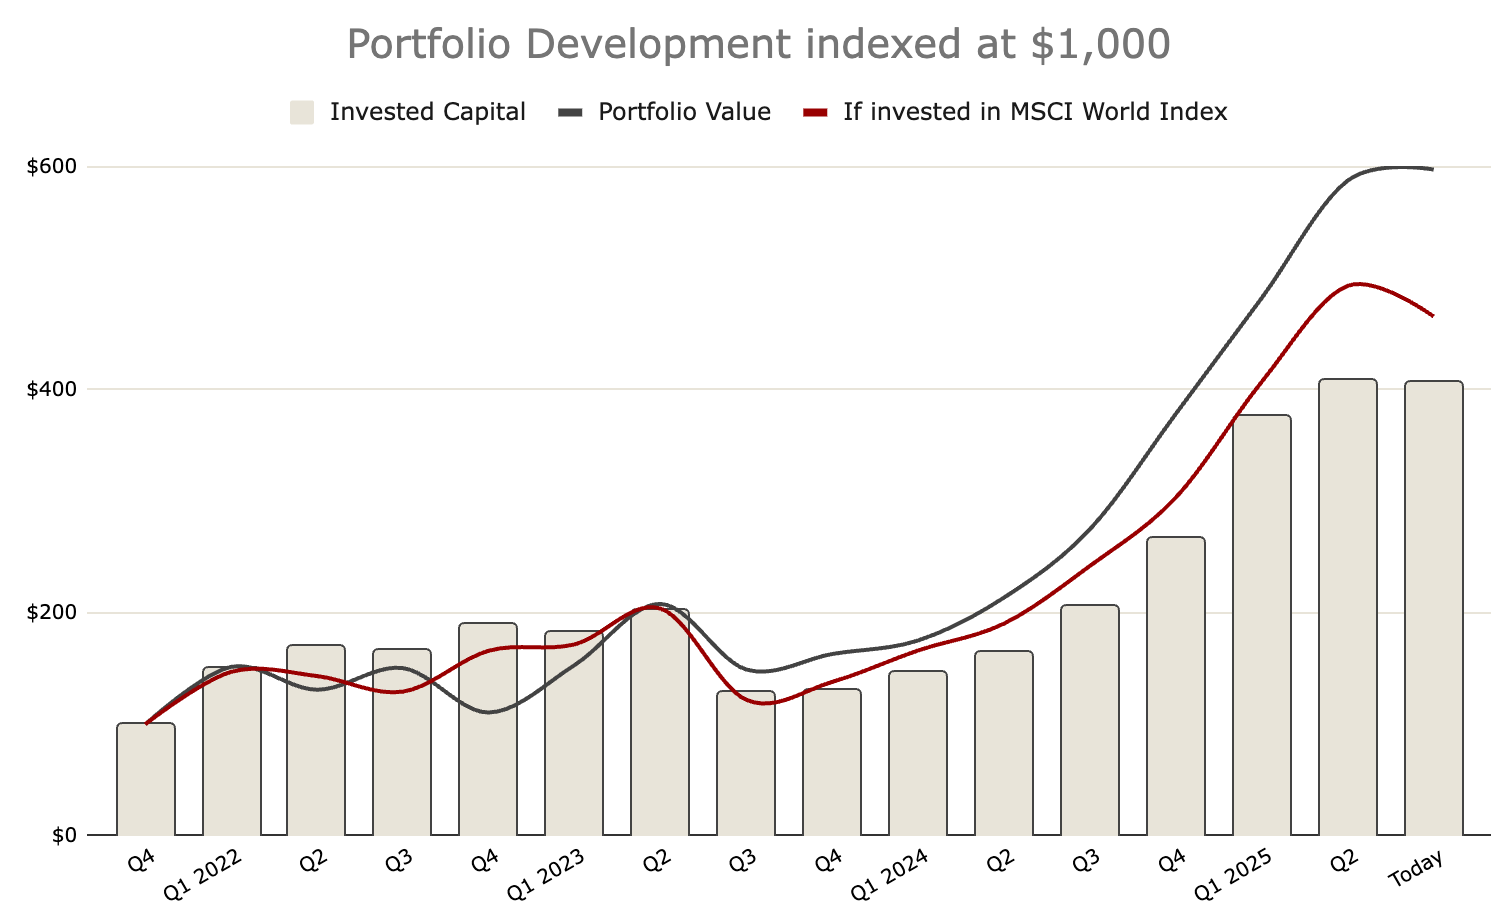
As you can see, today is a favourable point to measure returns. Things looked much worse in Q4 2022 especially, and we lagged the index for most of our first 2 years.
Total Return
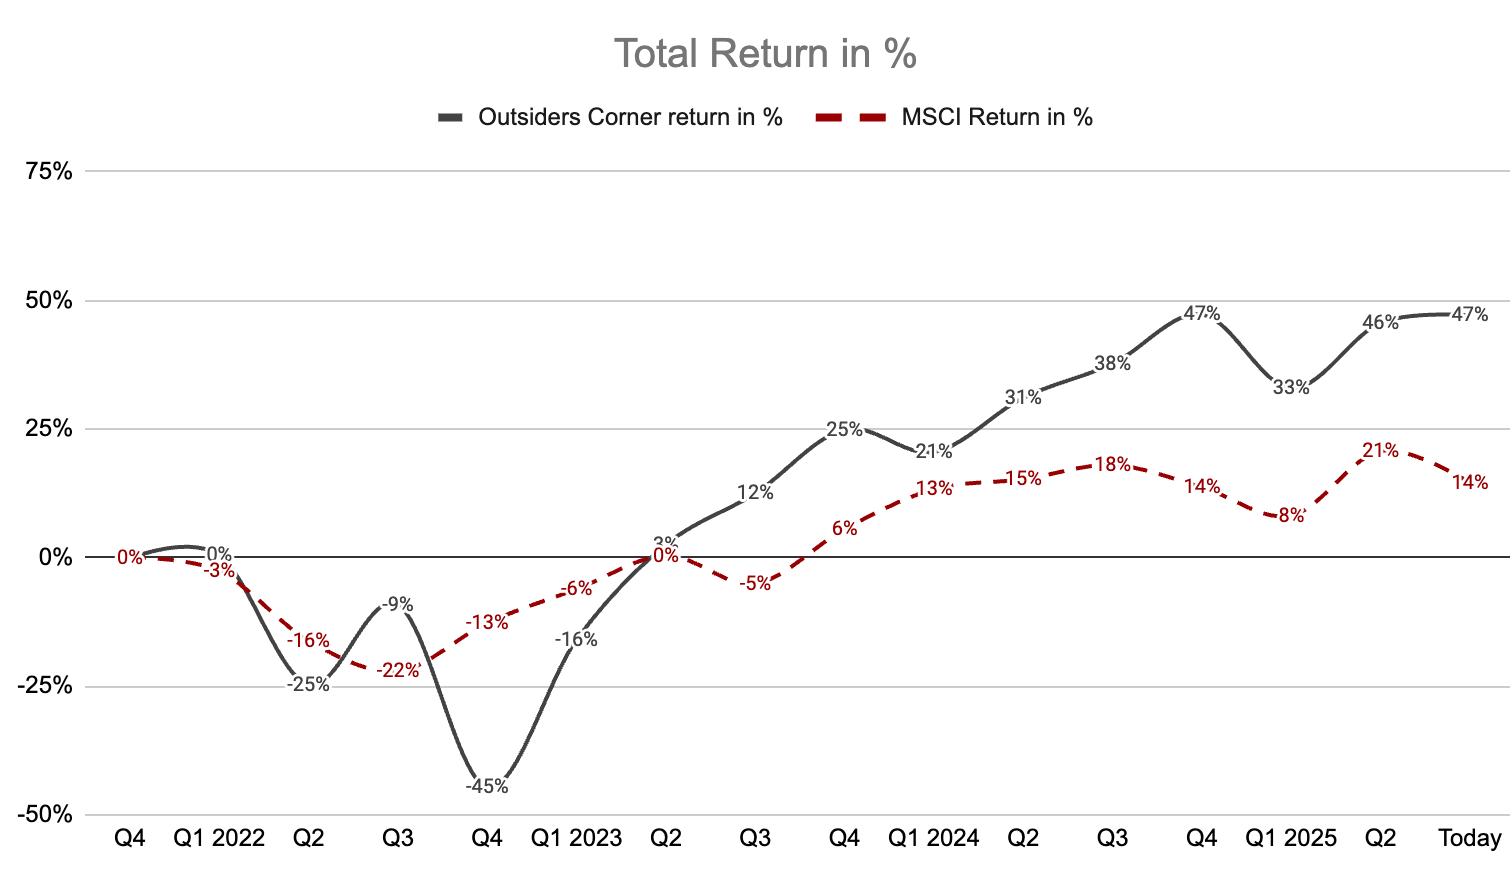
Total Returns as of today stands at 47% for us vs MSCI at 14% (July 16th, 2025). Remember that the returns here are made using similar cashflow, which means capital where added in similar amounts each quarter to the two alternatives. One lump-sum investment in both alternatives at the starting date, would have yielded higher returns.
Money-Weighted CAGR
To calculate our money-weighted CAGR, we don’t actually need to go through the total return step. All that’s required is the cash flow data and the ending portfolio value. Using the XIRR formula, we plug in the cash flows along with their corresponding dates. The final value reflects what the portfolio would be worth if everything were sold on the last day.

Money-weighted CAGR as of today: 21%
So, do we put two lines under the answer and call it done?
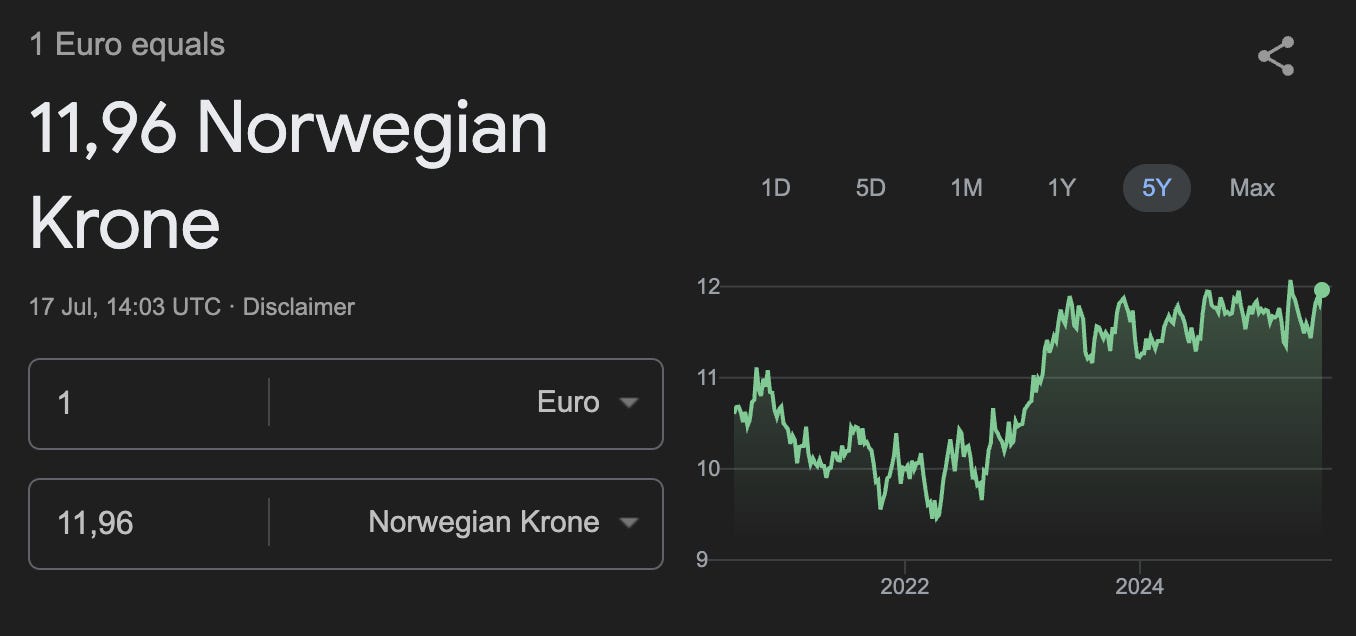
Not quite. Our investment strategy spans multiple geographies — including North America, Central Europe, and our home markets in Scandinavia. Because of this global exposure, currency fluctuations play a big role — especially since our portfolio is measured in Norwegian kroner (NOK), which has weakened significantly in recent years.
What does that mean in practice?
It means our reported returns are boosted by a falling home currency. By how much? That’s tricky to calculate — six currencies, constantly shifting allocations, lots of exposure to “weak currencies” like NOK and SEK etc.
But, we guestimate that in a currency-neutral world, our CAGR would be closer to 15%, rather than the 21% shown.
To conclude, we probably would need half a decade more before we could see whether we have any skills at this. Nevertheless, we enjoy investing, more than just looking at a bank account statement.
That’s it for now.
Cheers,
Ole
Disclaimer: This newsletter is for informational and educational purposes only. The views expressed are my own and do not constitute financial advice or recommendations to buy or sell any securities. All investments involve risk, and past performance does not guarantee future results. The analysis shared is based on my personal research and is not tailored to individual circumstances. Please consult a qualified financial advisor before making any investment decisions.
If you are interested in checking out some of my writeups, I’ll leave links for the 3 most popular ones to date.


