Investor is not a company you can fully grasp through stock screeners or even through its own income statement. To understand how this giant continue to compound so well, you need to look deeper. For those interested in this century old conglomerate, I’ll include a link to my previous analysis below.
This writeup aims to uncover the value drivers behind the century-old, market-leading Swedish conglomerate. Key topics:
The Dual Reinvestment Engine
NAV vs Consolidated Profits
10-Year Fundamentals
Key Takeaways
In the previous writeup, I introduced the Dual Reinvestment Engine—an essential concept for understanding how Investor AB compounds its asset value.
The first component of this engine involves Investor reinvesting its cash flow. This cash flow comes from various sources: dividends received, profits from wholly-owned Patricia Industries, or proceeds from asset sales. Over the past five years, the majority of reinvestments have been directed into Patricia.
The second component relates to Investor’s part-owned companies (e.g., Listed companies and EQT) retaining a portion of their earnings. The growth in retained earnings is evident in Investor’s part-ownership in listed companies, such as Atlas Copco and its spinoff, Epiroc.
However, retaining earnings only makes sense for quality companies—those capable of reinvesting capital at strong returns, above their cost of capital. With both Atlas Copco and Epiroc consistently delivering returns on capital employed (ROCE) above 25%, they are prime examples of this.
At the heart of this reinvestment model is a virtuous cycle: profits generated by Investor's subsidiaries are reinvested, fueling Net Asset Value growth. Over time, this NAV expansion supports long-term share price appreciation. In holding companies, however, this dynamic is often overshadowed by an emphasis on discounts to asset values, which can offer a margin of safety. Yet, it’s the underlying value creation and fundamental progress within the businesses that drive the majority of returns. As these assets perform, the share price follows. Coupled with strategic cash flow allocation across diverse revenue streams, the holding company becomes a powerful compounding engine, able to deploy capital opportunistically for sustained growth.
Net Asset Value vs Consolidated Profits
Investor AB’s income statement can be challenging to interpret due to fluctuations in the fair value of its investments, making it difficult to gauge the company’s true performance. As a result, one popular approach is to use metrics like the development of Net Asset Value (NAV) and the discount to NAV to assess the company’s health. However, these metrics have their limitations.
Around 75% of Investor AB’s NAV comes from publicly traded companies, which are valued at market prices. Ironically, this allows Investor’s stock to trade at a significant discount to NAV, even if the underlying companies were trading at inflated prices—something that doesn’t wouldn´t signal great value in itself.
Similarly, during 2023, many viewed Investor AB as increasingly overvalued due to the shrinking discount to NAV. However, this perspective missed a crucial point: The real driver behind the NAV growth was the rapid profit growth within Investor’s subsidiaries, as highlighted by the green bars below.
Over the long run, the stock market is a weighing machine
If someone suggested the quality of Investor´s portfolio is worth roughly 20x these diversified profits before tax, the black line should follow the green bars over time. Thus, the multiple to underlying earnings have actually decreased since 2020.
Nonetheless, the growth in profits above equals a ~25% CAGR in profits since 2020, a number which sounds to good to be true. Hence, I calculated the 10-year numbers as well, showing that 2020 was a particularly favourable comparison year.
10-Year Fundamentals
Listed Portfolio
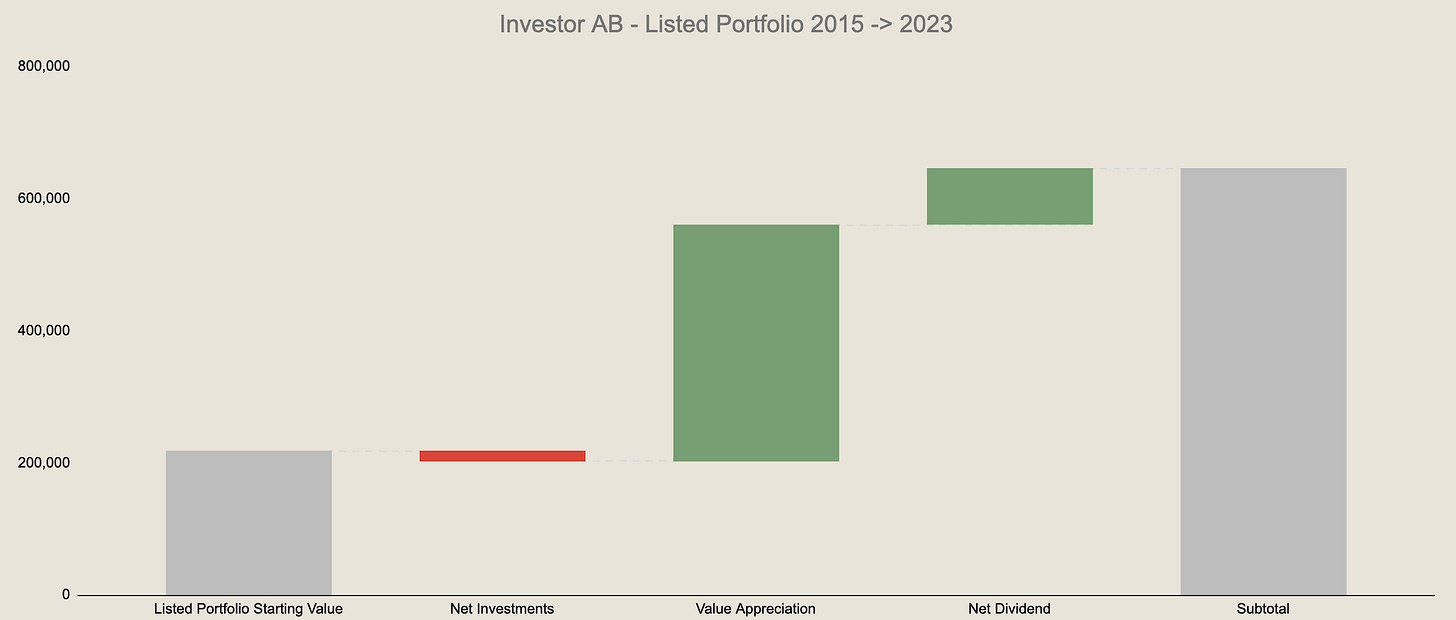
Below you can see the development in NAV for Investors listed portfolio. What strikes me, is the low cumulative investments since 2014 (dotted line). Considering the cumulative dividends received (~75B SEK), this means Investor extracts more capital than they put into this portfolio - making the NAV growth even more impressive.
- Winners Keep on Winning
Investor´s portfolio inactivity has led to the best performers concentrating itself. More specifically, ABB and Atlas represented 35% of the Listed NAV in 2014, compared to 52% (incl. Epiroc) at the end of 2023.
The waterfall chart below, highlights how much value creation has happened within the Listed Portfolio, compared to the minimal reinvestments from Investor (red).
- Individual Companies
Taking a look at the total return behind these companies, you can see who the winners are. The dark green colour also show dividends received (not reinvested), highlighting companies like AstraZeneca and SEB, which have been great for providing Investor with cashflow.
Since 2015, these companies have delivered a (weighted avg.) return of 188% in market appreciation alone, compared to ~100% for the OMX Nordic 40. However, if the Wallenberg´s had decided to keep an equal weighting since 2015, it would be closer to 150%. Either way, very impressive performance.
- Breakdown of Shareprice Appreciation
With a stock-price being determined by two key factors: earnings and the price multiple applied to those earnings, we can break these down and see what has driven past returns. Additionally, I seperated earnings into into sales growth and margins.
As you can see above, the Listed Portfolio has benefited significantly from multiple expansion over the last decade, contributing 34% of all the NAV growth. While this may be justified by factors like improved revenue quality, stronger competitive positioning or higher margins, it’s unlikely that a similar multiple expansion will continue forever. Nonetheless, the fundamentals (growth and margins) has still developed very nicely.
Considering this, the 188% return over the last decade, would have been closer to 125% without the multiple expansion. This would equal an 8% CAGR instead of 11%. Still, very solid numbers. Especially, when you add in the other parts of the portfolio.
Patricia Industries: The Serial Acquirer
Tucked within Investor AB's portfolio lies its wholly-owned Serial Acquirer, Patricia Industries, which comprises 10 individual companies. These businesses, primarily focused on healthcare niches, share a common trait: market-leading positions. With a compound annual sales growth rate (CAGR) of 10% and strong margin improvements, Patricia Industries has become the primary reinvestment vehicle for the Wallenberg family—and its importance continues to grow.
From 2015→2023, Investor reinvested a net total of 32B SEK into Patricia Industries. With this reinvestment engine going - I would not be surprised seeing the Patricia companies become increasingly large parts of the portfolio. The adjusted asset values of these companies are valued (more consistently and conservative) by a 3rd party.
EQT AB
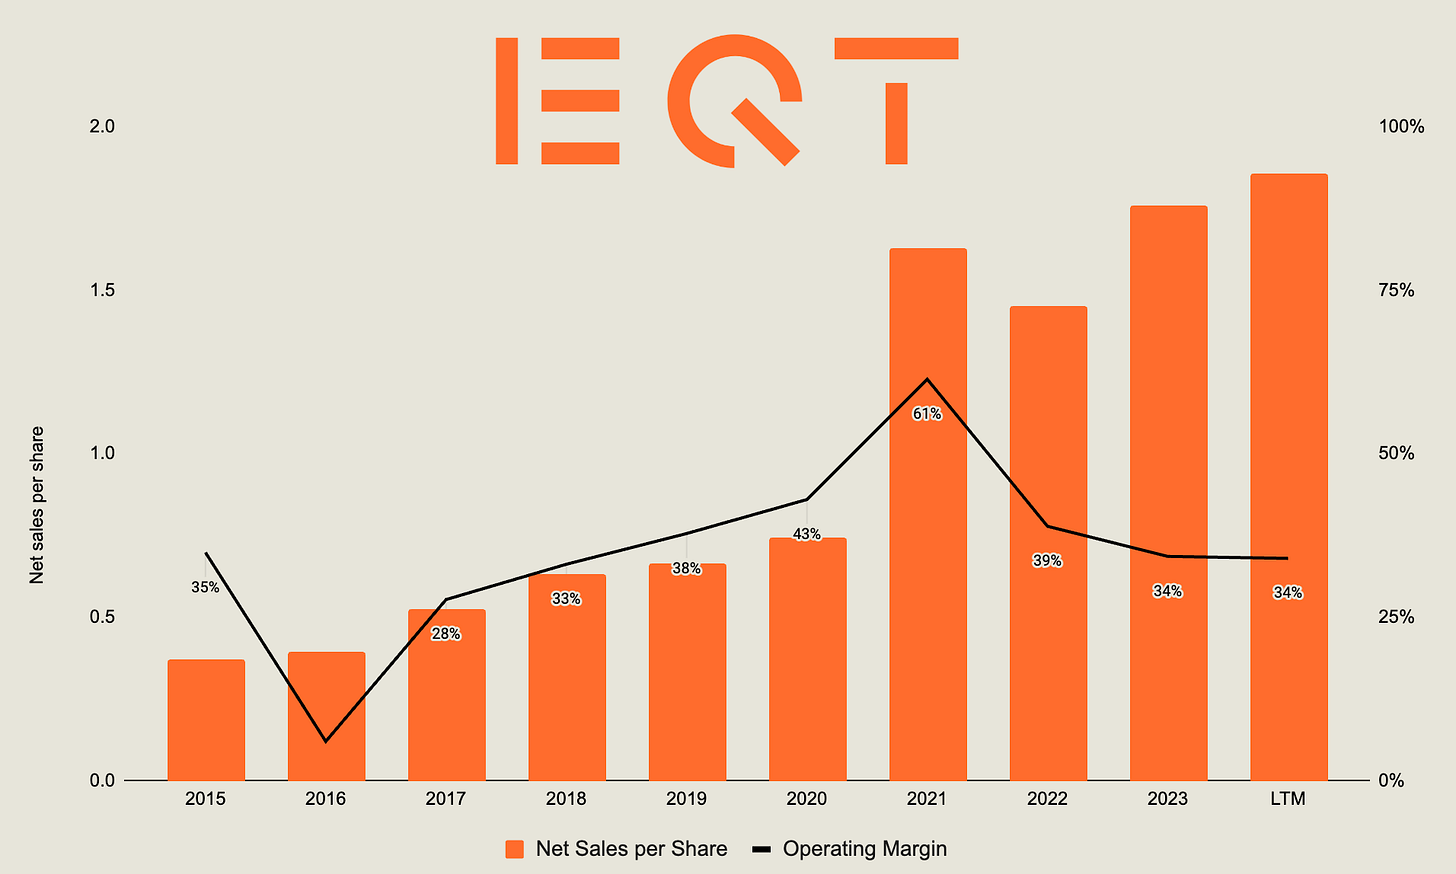
EQT AB, founded in 1994, is a global alternative asset giant, with Investor AB holding a majority ownership stake of 14.7%. Even accounting for dilution, EQT’s performance—measured by net sales per share—has been remarkable. Today, EQT AB is valued at around $39 billion and stands as a leader in private equity, infrastructure, and venture capital.
From 2015→2023, Investor has received 23 billion SEK in net proceeds from EQT AB. Investor also holds stakes within several of EQT´s funds, which are not included here.
Investor Consolidated Profits
By consolidating Investor AB’s share of the operating income from its Listed Portfolio, EQT, and wholly-owned Patricia Industries, we arrive at Investor's Consolidated Operating Income. While much of this income doesn’t directly flow into Investor’s bank accounts, it still represents their stake in these businesses. Think of it like owning farms outside your property.
Analyzing this consolidated figure provides a clearer view of Investor AB's fundamentals compared to its share price.
The valuation multiple on Operating Income has expanded significantly, increasing from approximately 10x in 2015 to around 20x today. However, it's important to note that Investor’s profits actually declined from 2015 until 2017, with minimal growth all the way until 2020, suggesting that the low multiple in 2015 may have been justified, given the potentially poor outlook at that time.
Nonetheless, this multiple expansion has played a major role in the 18.5% CAGR of Investor’s share price over the past decade (21.5% including dividends). A valuation tailwind unlikely to continue - warranting caution in extrapolating growth.
While debates may arise over whether the portfolio deserves to trade at a discount to NAV or what multiple is justifiable for the consolidated profits, the strengthening fundamentals cannot be overlooked, as illustrated in the graphs below.
With the three segments, Listed, Patricia and EQT, compounding respectively at a CAGR of 14, 17 and 25% over the last 5 years, there is no wonder the Investor share has grown at similar double digit rates, for such a long time, and especially as of late.
Key Takeaway
I would say the preceding graphs indicates that all three segments of Investor AB demonstrate traits of being Quality Compounders, characterized by stable margins and growth driven by strong returns on invested capital.
Within this portfolio, Atlas Copco and Patricia Industries are particularly noteworthy. Both with consistent high growth rates, driven by organic reinvestments and through acquisitions. Atlas Copco, in particular, boasts a diverse portfolio of over 50 brands, showcasing its expansive nature and decentralized structure, even 150 years after its founding. As I detailed in my recent writeup on Serial Acquirers, Atlas Copco has a similar decentralized structure, comprising 23 divisions within 4 business units.
- Wallenberg´s role behind the Scenes
Impressively, the Wallenberg Family has not only been an investor in most of it´s holdings. With regards to Atlas Copco, they were one of three parts founding it back in 1873. The importance of having Wallenberg´s as long term owners, was already illustrated in the recession of the 1880´s, halting the construction of railroads, the only sector Atlas served back then.
1880: New capital was injected from the Wallenberg family and the company changed its name to Nya Atlas (New Atlas). Production shifted to more advanced products, such as steam engines and boilers. In short, the company reacted and adapted to new times. (Atlas Copco History)
Further, the Wallenberg family was key in avoiding bankruptcy two times during the second world war, for the then merged giant Atlas Diesel. They reconstructed the company two times, but realized that making diesel engines would not be a lucrative sector to be in. Already in 1948, Atlas Diesel stopped making diesel engines, and rather focused on more technical niches, primarily within pneumatic tools, compressors and drilling equipment. Focus areas they, and spinoff Epiroc, are still market leaders within today.

The Ability to Change
Moving back to today, the ability to change stands as a core value across the family-owned portfolio. Combine this with family-owners thinking in generations rather than quarters, it may not be an understatement to suggest that having Investor as an owner may be a competetive advantage in and of itself. Considering this, it should not come as a surprise, that Investor´s portfolio, looks to be in prime position within many of the areas they operate - most of which seem to have structural tailwind behind them. Tresor Capital highlighted a few in their recent letter:
Digitalization, Automation, Sustainability & The Rise of Alternative Investments
Tresor Capital also highlighted some crucial aspect of the holding company in their May Report, with a great quote from previous CEO of Investor AB, Johan Forsell.
Our businesses don’t compete with each other, for example we don’t own shares in both Epiroc and Sandvik. And that’s a real advantage because it means that we can bring together key people in our businesses and let them share experiences in these important areas, whether it’s sustainability, technological transition or China for example. We can share experiences and discuss important issues. It’s a very crucial part of our business model.
Conclusion
To summarize, Investor AB’s fundamentals across all 3 segments continue to grow well, though future share price growth should moderate from high double digit rates. This is largely due to the multiple expansion seen over the last decade—a tailwind that rarely continues in one direction indefinitely. On the other hand, comparing the portfolio of Investor at ~20x Operating Earnings (consolidated) against other stable compounders, the price may not be that high after all. However, it all will depend on the future performance, which we will get more light on with Q3 next week.
With most Investor portfolio companies having market-leading positions in niche sectors, combined with management teams with proven ability to reinvest capital wisely—either by Investor directly or through the underlying companies retaining earnings—the returns on this incremental capital will drive a lot of future performance.
Unsurprisingly, Investor's subsidiaries seem to be well-positioned within sectors benefiting from durable tailwinds, including healthcare niches, automation, sustainability, and alternative assets, as highlighted by Tresor Capital.
Furthermore, the long-term stewardship of Investor AB offers a unique advantage. Further, with Investor management in the boardrooms, these companies can not only share best practices across industries, but also tap into top talent through the Wallenberg Foundation's support for research and education in Sweden. It’s no coincidence that the sectors receiving research funding align closely with the industries Investor’s companies operate in, creating a powerful synergy for continued success & sustain Investor recipe for durable success - The Ability to Change.
Thanks for reading Outsiders Corner! If you are interested in learning more of holding companies, I have several writeups on this page, but I would also recommend checking out Tresor Capital, publishing great details on some excellent compounders.
As always, none of this is financial advice.
Cheers, Ole

